Background and question
Schools and systems regularly choose between professional-development formats such as workshops, conferences and peer networks, and TALIS records which of these formats teachers take part in. For this independent analysis of the TALIS 2024 survey, I asked whether participation in eight professional-development formats was associated with lower-secondary teachers’ confidence in using a variety of assessment strategies.
The process
Preparing the data
I read the TALIS 2024 international teacher file in chunks and filtered it to the 1,271 Dutch lower-secondary (ISCED 2) teachers, of whom 1,179 answered the outcome question. Reserved codes for missing or inapplicable answers were recoded as missing on a clean copy of the data, and the survey’s own labels were extracted so that each item could be matched to its question wording. The outcome was a four-level self-report of how much teachers can use a variety of assessment strategies, and each professional-development item was coded as taking part, whether in person, online or both, or not taking part. Courses, workshops and seminars had no valid Dutch responses and were therefore not analysed.
Comparing participation groups
For each format, I compared participants with non-participants using two-sided Mann-Whitney U tests, a rank-based comparison that does not assume normally distributed scores, and reported the rank-biserial correlation (r) as an effect size, where positive values mean participants scored higher. A comparison ran only when both groups had at least 30 teachers, which all eight formats met. Since the main tests ignore the survey’s sampling design, I added a check that used the teacher weight and the survey’s 100 balanced repeated replication (BRR) weights, which estimate uncertainty for weighted survey data.
As a further sensitivity check, I entered all eight formats together in one regression, with standard errors clustered by school to allow for teachers in the same school resembling each other. I repeated it as an ordered logit, which treats the four-level outcome as ordered categories.
Findings
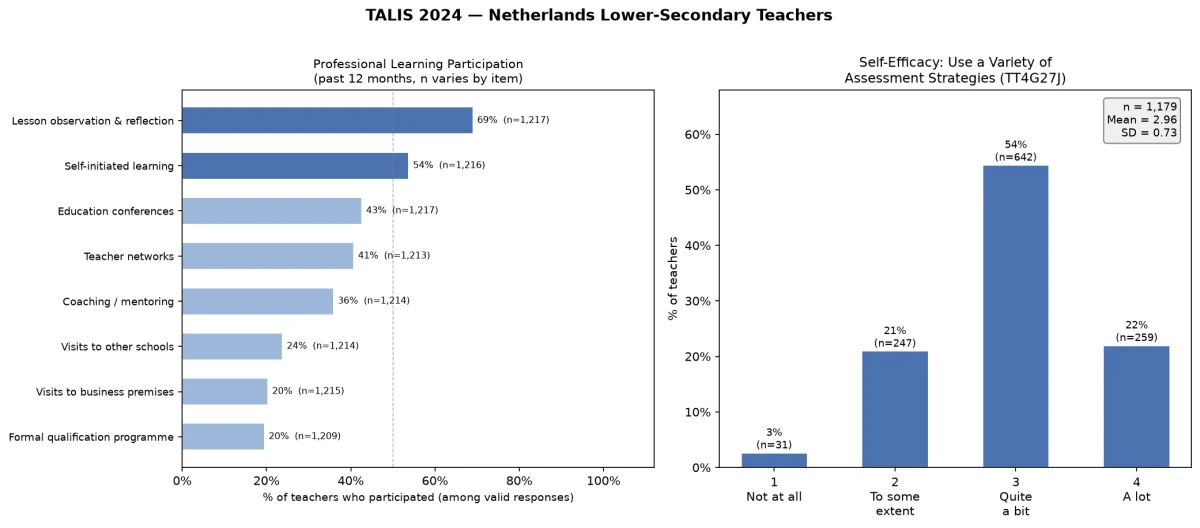
Lesson observation and reflection had the highest participation at 69 percent, followed by self-initiated learning at 54 percent and education conferences at 43 percent, while formal qualification programmes had the lowest at 20 percent. Among the 1,179 valid answers, mean confidence was 2.96 on the four-level scale (SD 0.73), with 54.5 percent of teachers choosing quite a bit and 22 percent a lot.
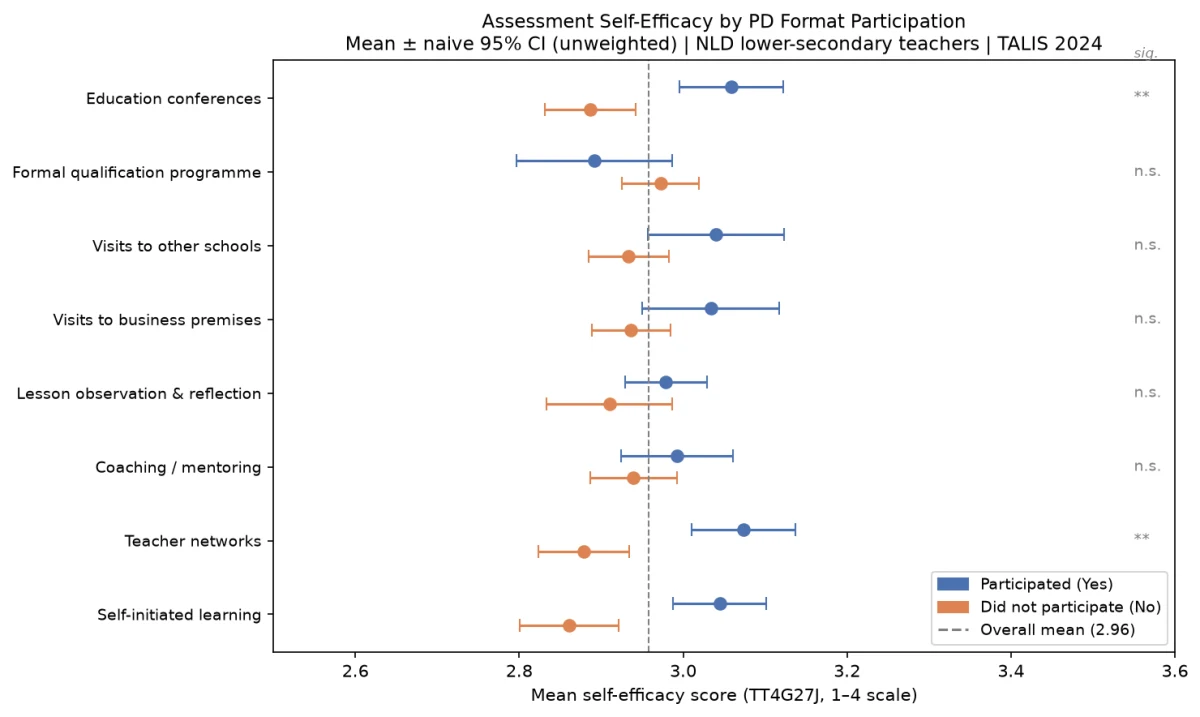
Three formats were associated with higher confidence, namely education conferences, teacher networks and self-initiated learning. Participants in these formats scored about 0.17 to 0.20 points higher on average, which corresponds to small effects (r between 0.12 and 0.14, p below .001), and the weighted check gave the same three results. Visits to other schools came closest among the remaining five formats (p = .053), none of which showed a significant difference.
When all eight formats were entered together (1,135 complete cases), the same three stayed positive and significant at .05, with coefficients of about 0.12 to 0.14 points, and the ordered logit agreed. Teacher networks and self-initiated learning passed the Bonferroni threshold in that model, while education conferences narrowly missed it (p = .0064 against .00625). Formal qualification programmes had a weakly negative estimate in every analysis but reached significance only in the ordered logit (p = .042), so I treat that result as unstable.
Limitations and next steps
The data come from a cross-sectional, self-reported survey, so they cannot show whether the formats build confidence or whether more confident teachers choose them. The main tests and plotted intervals are unweighted and ignore school clustering, and the weighted check is a simple comparison of means without further adjustment. The OECD country note for the Netherlands (7 October 2025) states that the Dutch sample did not meet the TALIS participation-rate standards, so non-response bias is possible. Eight tests were run without formal adjustment, although in the one-at-a-time tests the three significant results also pass a Bonferroni threshold of .05 divided by eight.
The one-at-a-time tests used no covariates, the joint model included no teacher or school characteristics, participation in different formats may overlap, and the format items say nothing about the content, duration or quality of the learning. A next step would be to use the survey item on whether professional development covered the analysis of student assessments, to model teachers within schools together with teacher characteristics, and to run a full design-based model with the survey weights.