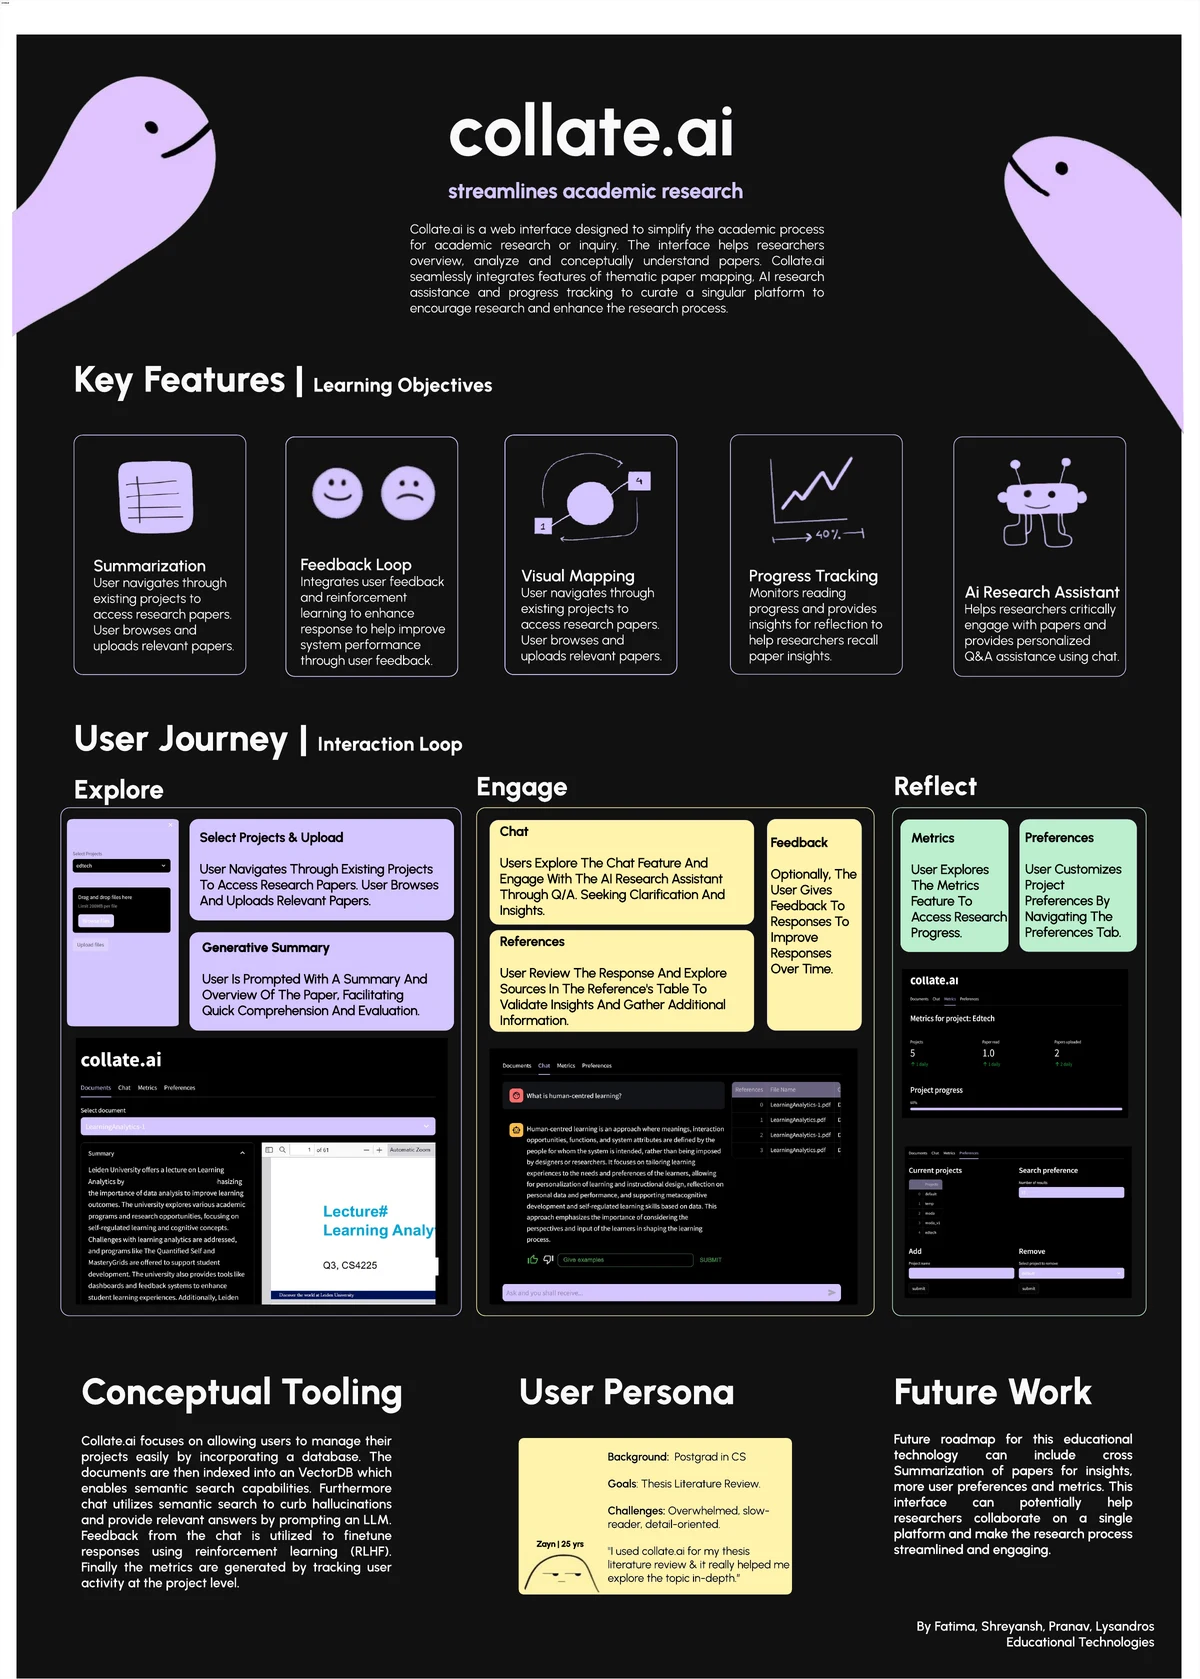
This page covers two projects, and the second grows out of the first. The first is collate, a group class project at Leiden University in 2024. The second is my own ongoing research, which began with collate’s open questions and is still in progress. The page follows that order, so the group work comes first and my independent work starts under the second heading.
Collate
A group class project
The problem
For an Educational Technologies course, Shreyansh, Lysandros, Pranav and I asked how a tool could help researchers with the parts of their work that tend to scatter. Those parts were finding relevant papers, organising and synthesising materials, tracking progress, and getting guidance from the literature review to the final paper. Our question was how we might streamline the research process for academics, students and independent researchers while addressing their main pain points. Collate began as an attempt to address the challenges student researchers face. As we worked on it, we realised that supervisors and other academic stakeholders face numerous challenges of their own.
Learning theories behind the design
We grounded the design in learning theory. Cognitive Load Theory (Sweller, 1988) shaped how we thought about reducing the effort of handling many papers. Constructivist and experiential theories (Piaget, 1969; Vygotsky, 1978) pointed us towards interactivity and active engagement. Self-regulated and situated learning (Zimmerman, 1989; Lave and Wenger, 1991) supported features such as progress tracking and guidance. We also used conceptual mental models, which are representations of how people understand a system.
Explore, Engage and Reflect
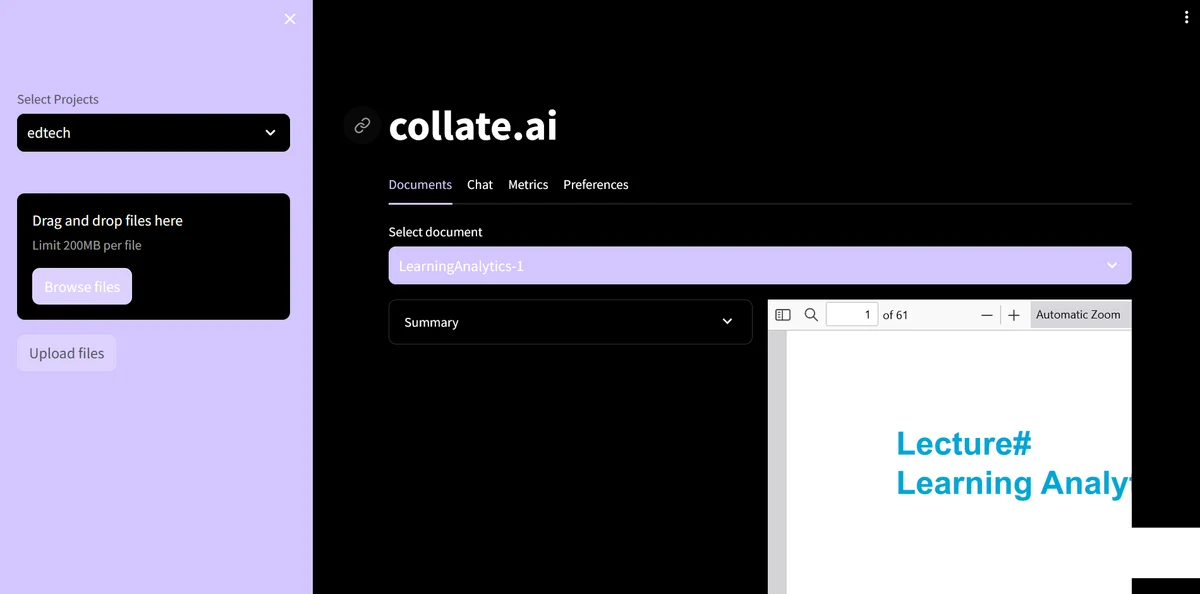
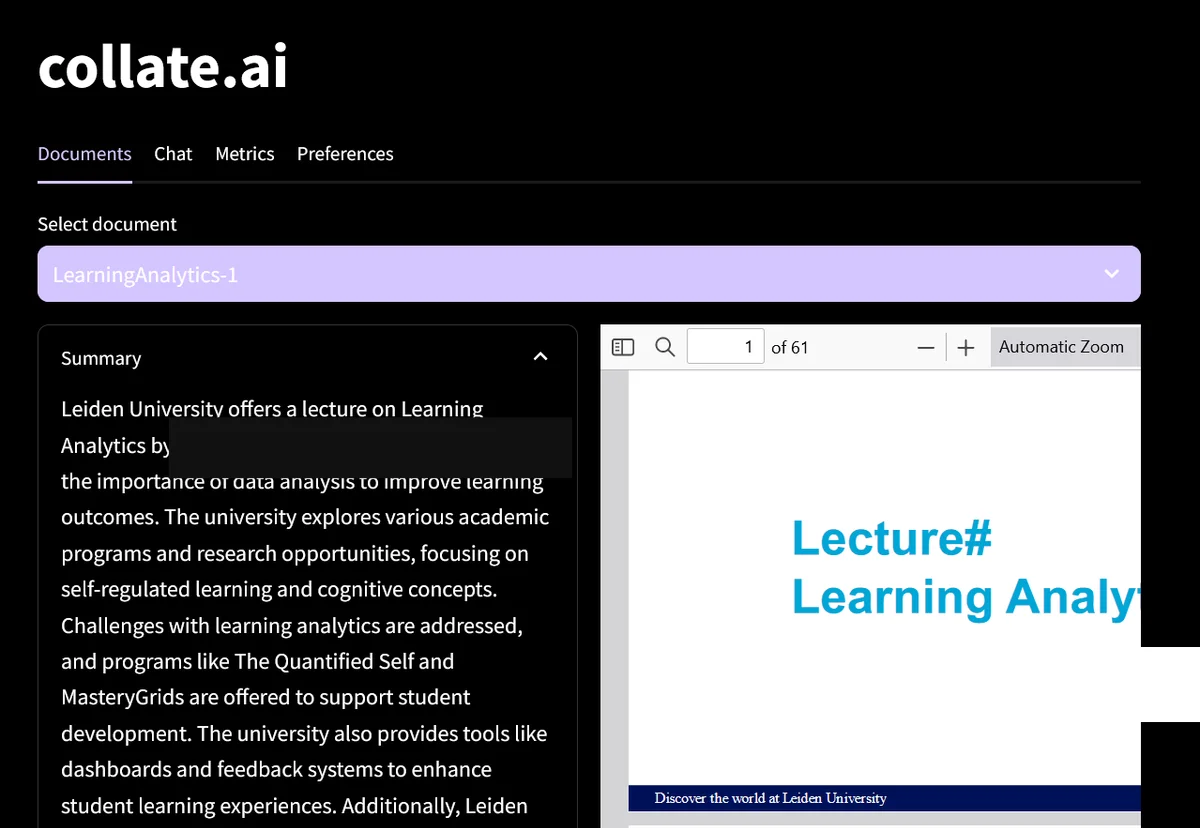
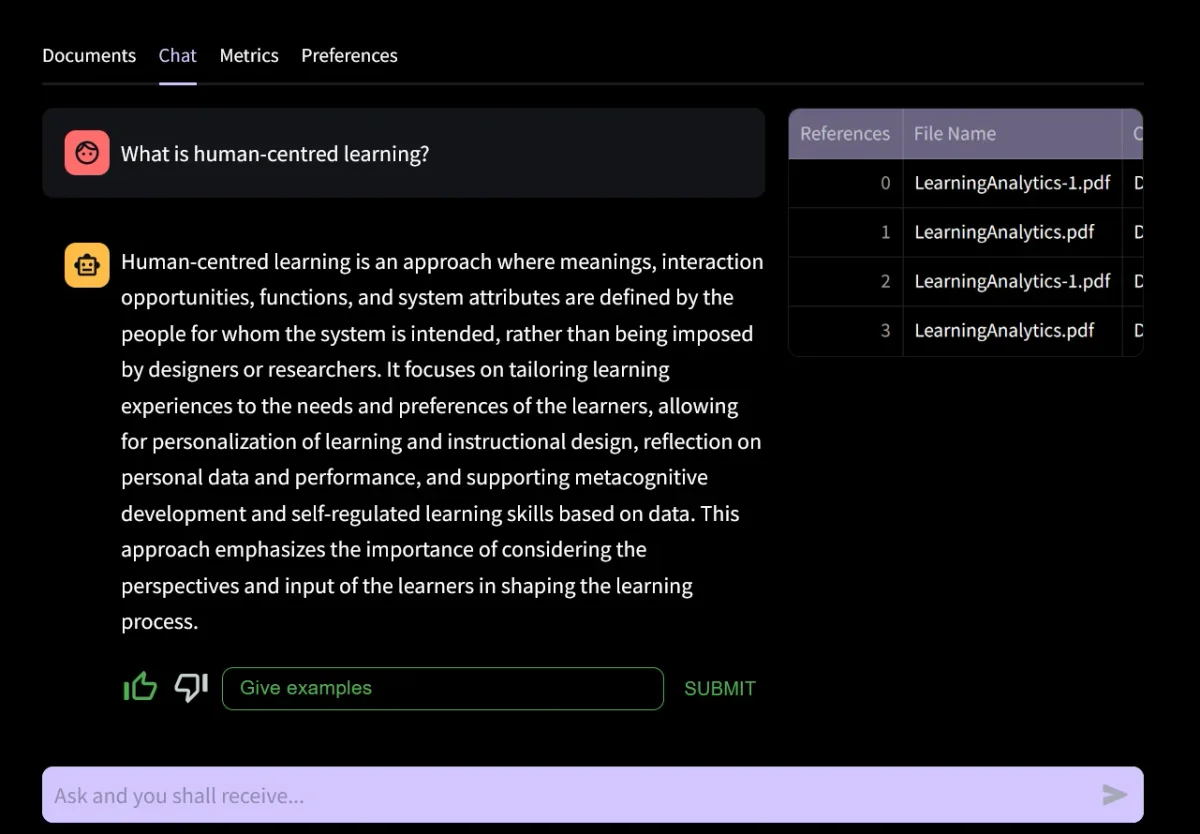
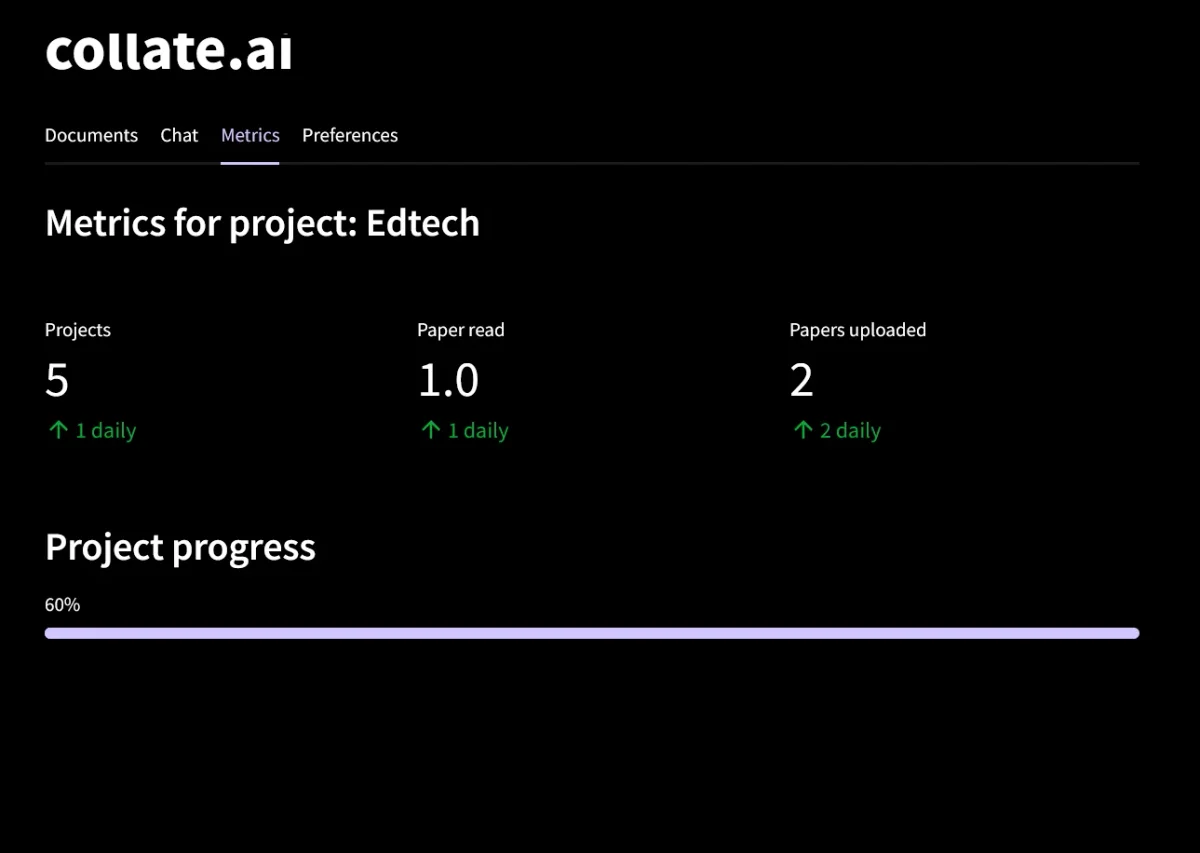
The concept became three linked modes. In Explore, a researcher selects a project, uploads papers and reads a generated summary. In Engage, they ask questions about the papers, check the references behind each answer and give feedback on the response. In Reflect, they look at progress metrics and set project preferences.
The poster and the tool
The required outcome for the course was a poster, which is shown at the top of this page. It sets out the key features, the three modes, a persona, the conceptual tooling and future work. Beyond the poster, we developed a working web tool, and the screens below come from it.
What we did not evaluate
We did not user-test or evaluate collate. We had planned to compare reading with and without the tool, looking at uptake, reading speed, papers per day and tiredness or overwhelm, but that comparison was not completed. The poster and tool therefore show the concept and what we built, and they say nothing yet about whether it helps researchers.
Research workflow
Ongoing research
Why a survey
Collate grew out of student researchers’ challenges, and working on it showed us that supervisors and other academic stakeholders have many of their own. I wanted to look at all of these groups together instead of isolating any of them, and I wanted evidence about how they actually work before building further. This part is my own action research. It aims to ground the design in evidence and to develop it through cycles of identifying a problem, trying a solution and gathering feedback from the people it is for.
The literature already points to real difficulties. In one study, 66% of La Salle University student researchers struggled to complete their research on time (Bocar, 2009). In Turkey, 62% of postgraduate students named methodology issues as their main challenge (Akyurek and Afacan, 2018). Nearly 70% of researchers had difficulty balancing academic workload and personal commitments (Kulkarni, 2021). A survey let me see whether a small group of researchers I could reach described similar problems.
Competitor analysis
I compared Zotero, Mendeley, Notion and Khanmigo, which is Khan Academy’s AI tutor. Zotero and Mendeley are strong on citations but do little for the wider research workflow. Notion is flexible but needs manual setup, and Khanmigo supports learning more than research. Two gaps stood out. None of the four offers structured advisor feedback integration, and progress tracking exists only as something a user sets up by hand in Notion.
Research question and objectives
My question is how we might streamline the research process for academics, students and independent researchers while addressing their key pain points. The objectives are to discover how researchers organise, analyse and track their materials, to identify pain points in academic research workflows, and to find which features would improve efficiency and encourage successful outcomes.
Methods, done and planned
I am using a mixed-methods approach. Two parts are done and the rest are planned.
Done so far are the literature review, the competitor analysis and the survey. The survey is described below, and the personas and journey maps were built from its responses.
Still planned are semi-structured interviews to understand the reasons behind the main pain points, focus groups with researchers from different fields to check the findings, and an ethnographic study of students in thesis advisor meetings or research courses. I will also build a low-fidelity prototype from the survey insights and test it with users. A wider review of global best practice, including Khanmigo, is also planned. None of these planned steps has happened yet.
The survey
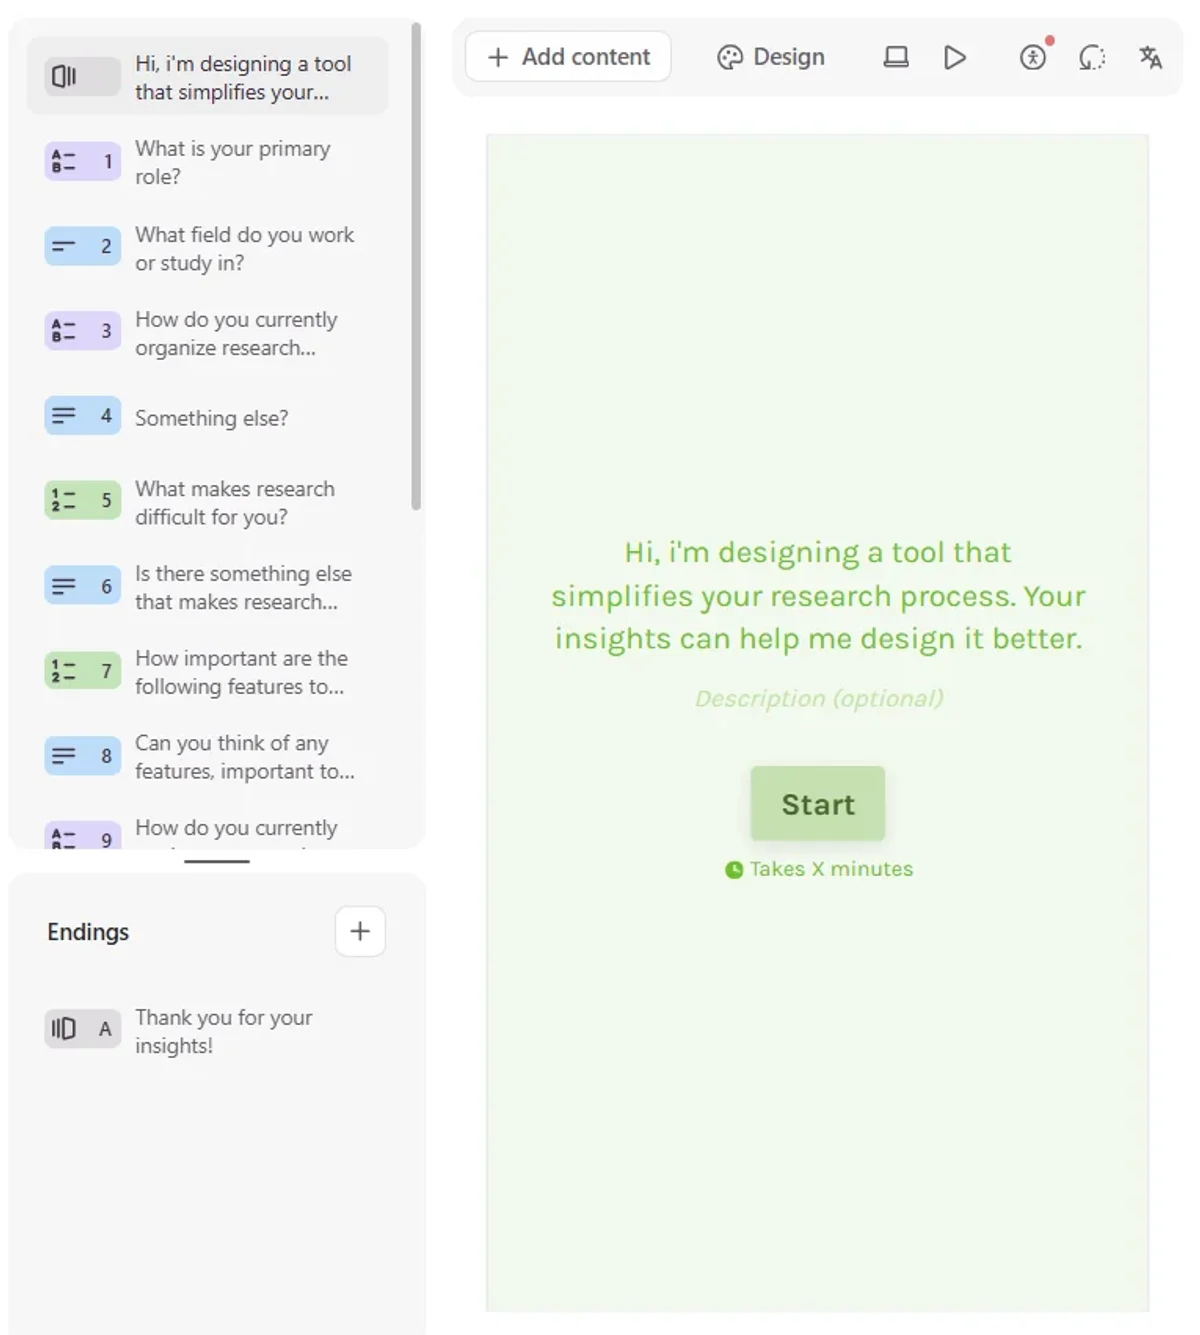
I made a short anonymised Typeform survey, chosen for its friendly interface and casual but purposeful tone. It asked how people organise papers, what makes research difficult, how important five features are, how they track progress, what makes monitoring progress hard, and which guidance formats they prefer. The target group was master’s and PhD students, faculty and independent researchers who were actively doing research or writing academic papers.
I recruited through snowball sampling, which included Leiden University students, and offered no incentives. Nine people responded between November 2024 and May 2025. They were two graduate students, two undergraduates, two postgraduates, one educator and two who chose other, working or studying in fields such as medicine, finance, classics, data science and electrical engineering. I first analysed seven responses, and two more have since come in. Eight of the nine answered both ranking questions.
Findings
Five of the nine respondents kept papers as computer files, and two said they had no system. For tracking progress, four said they had no systematic way, two used spreadsheets, one relied on supervisor meetings and one kept a manual journal. One left this blank.
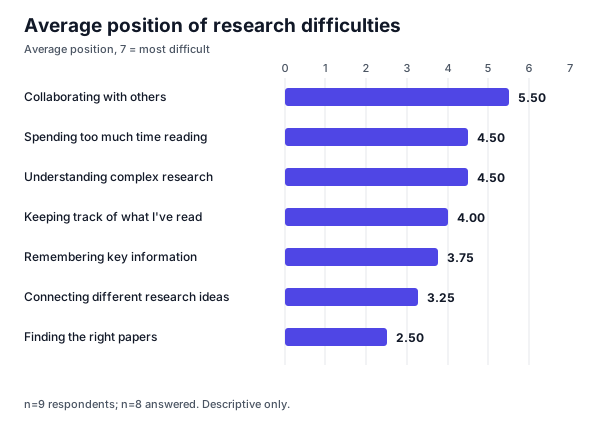
The difficulty question asked people to order seven items from most to least difficult, where 7 was most difficult. Collaborating with others had the highest mean position at 5.50. Spending too much time reading and understanding complex research were both at 4.50. Finding the right papers was lowest at 2.50. These are positions in an ordered list and not conventional ratings, and they come from eight answers.
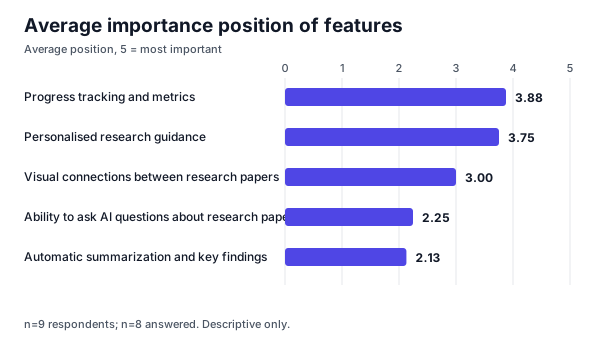
The feature question worked the same way, with 5 as most important. Progress tracking and metrics had a mean position of 3.88 and personalised research guidance had 3.75. Visual connections between papers scored 3.00, asking AI questions about papers 2.25, and automatic summarisation 2.13.
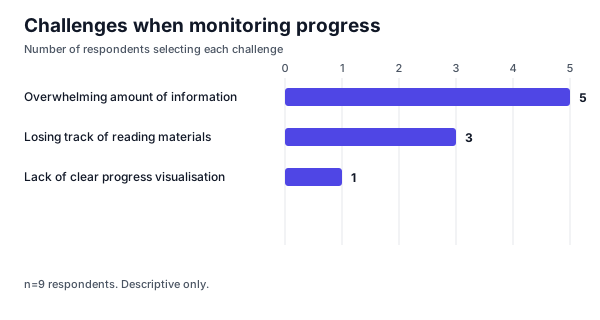
When asked what makes monitoring progress hard, five respondents chose an overwhelming amount of information, three chose losing track of reading materials and one chose a lack of clear progress visualisation.
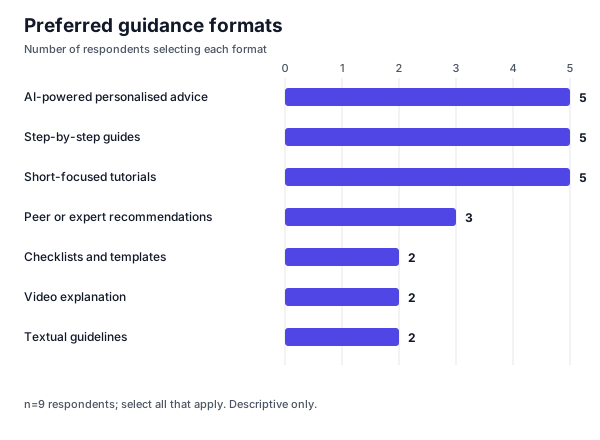
For guidance, respondents could pick several formats. Personalised AI advice, step-by-step guides and short tutorials were each chosen by five of nine, peer or expert recommendations by three, and checklists, video explanations and textual guidelines by two each.
Personas
I developed two fictional personas from the survey responses and the literature, a PhD student and a thesis advisor. They are not real people, and I used them to keep the likely needs of each group in view. No thesis advisor answered the survey, so the advisor persona draws on the literature and on what we saw while working on collate, which makes that perspective the least evidenced so far.
Sara, 29, the stressed PhD student
Third-year PhD student in electrical engineering
Pain points
- Overwhelmed by massive amounts of literature
- Struggles to track advisor feedback and revisions
- Finds it difficult to structure research milestones
Needs and goals
- A way to track reading progress and insights
- A structured system for advisor feedback and revisions
- Step-by-step research planning tools
Features required
- Progress tracking and milestones
- Feedback integration
- Collaboration with other PhD students and colleagues
- Step-by-step guides
Dr. Rob, 50, the overloaded thesis advisor
University professor and thesis advisor
Pain points
- Manages several students and struggles to track their progress
- Wants better collaboration tools for research discussions
- Needs to monitor students’ literature reviews and citations
Needs and goals
- A centralised system to monitor student progress
- Efficient ways to give structured feedback
- AI-generated summaries of students’ work
Features required
- A progress visualisation dashboard
- A research guide and checklists
- A feedback loop for online comments
Persona icons: "persona" by Yu luck, from Noun Project
Journey maps
A journey map follows one persona through the research process and shows where a tool like collate could help. I mapped Sara across six stages and Dr. Rob across four.
Journey map for Sara, the PhD student
Sara’s goal is to conduct a structured literature review and track research milestones.
| Stage | Task | Pain points | Role of collate |
|---|---|---|---|
| 1. Literature search | Find relevant papers | Overwhelming number of sources, and it is hard to filter for quality | AI-assisted smart search for relevant papers |
| 2. Reading and understanding | Summarise key ideas | Complex language, and key points are hard to extract | AI summarisation and key findings |
| 3. Organising and synthesising | Categorise research themes | Hard to track citations, and insights get lost | Visual mapping to connect research ideas |
| 4. Writing and structuring | Draft research sections | Struggles to integrate advisor feedback | A feedback loop to incorporate comments and edits |
| 5. Advisor meetings | Discuss progress | Unclear research milestones and misaligned expectations | A progress tracking and metrics dashboard |
| 6. Revising and submitting | Edit and finalise the thesis | Last-minute rush and a lack of structured guidance | A research guide with checklists |
Sara needs structured research tracking, feedback integration and organisation tools to streamline the PhD workflow.
Journey map for Dr. Rob, the thesis advisor
Dr. Rob’s goal is to track student progress and give feedback efficiently.
| Stage | Task | Pain points | Role of collate |
|---|---|---|---|
| 1. Reviewing literature | Evaluate the student’s research direction | Students lack a structured approach | Personalised research guidance |
| 2. Providing feedback | Annotate student drafts | Too many scattered versions of documents | A centralised feedback loop for revisions |
| 3. Tracking progress | Monitor research milestones | Hard to assess student progress at a glance | A progress visualisation dashboard |
| 4. Final review | Approve the thesis submission | Students miss key requirements | A final checklist and research guide |
Dr. Rob needs a centralised platform to track several students’ progress and give structured feedback.
Limitations and next steps
Nine respondents is a very small sample, recruited by snowballing, so the results cannot represent researchers in general. The mean positions record an ordering and not conventional ratings, and the survey does not show that collate improves anyone’s research. I read it only as a way to decide what to ask next.
Next I plan to run semi-structured interviews to find out why collaboration and understanding complex research rank so high, and why people prefer different guidance formats. Focus groups, an ethnographic study of advisor meetings and testing of a low-fidelity prototype follow after that.
Reflection
The sample was small, but the findings echo the literature. Researchers in the survey reported being overwhelmed by information, having no system to track progress and finding collaboration hard, which fits the earlier studies on time, methods and workload. That gives me reasonable grounds to keep going with interviews and focus groups, and to keep the design tied to what researchers say they need.